My Projects
Bus Transportation Analysis Interactive Excel Dashboard
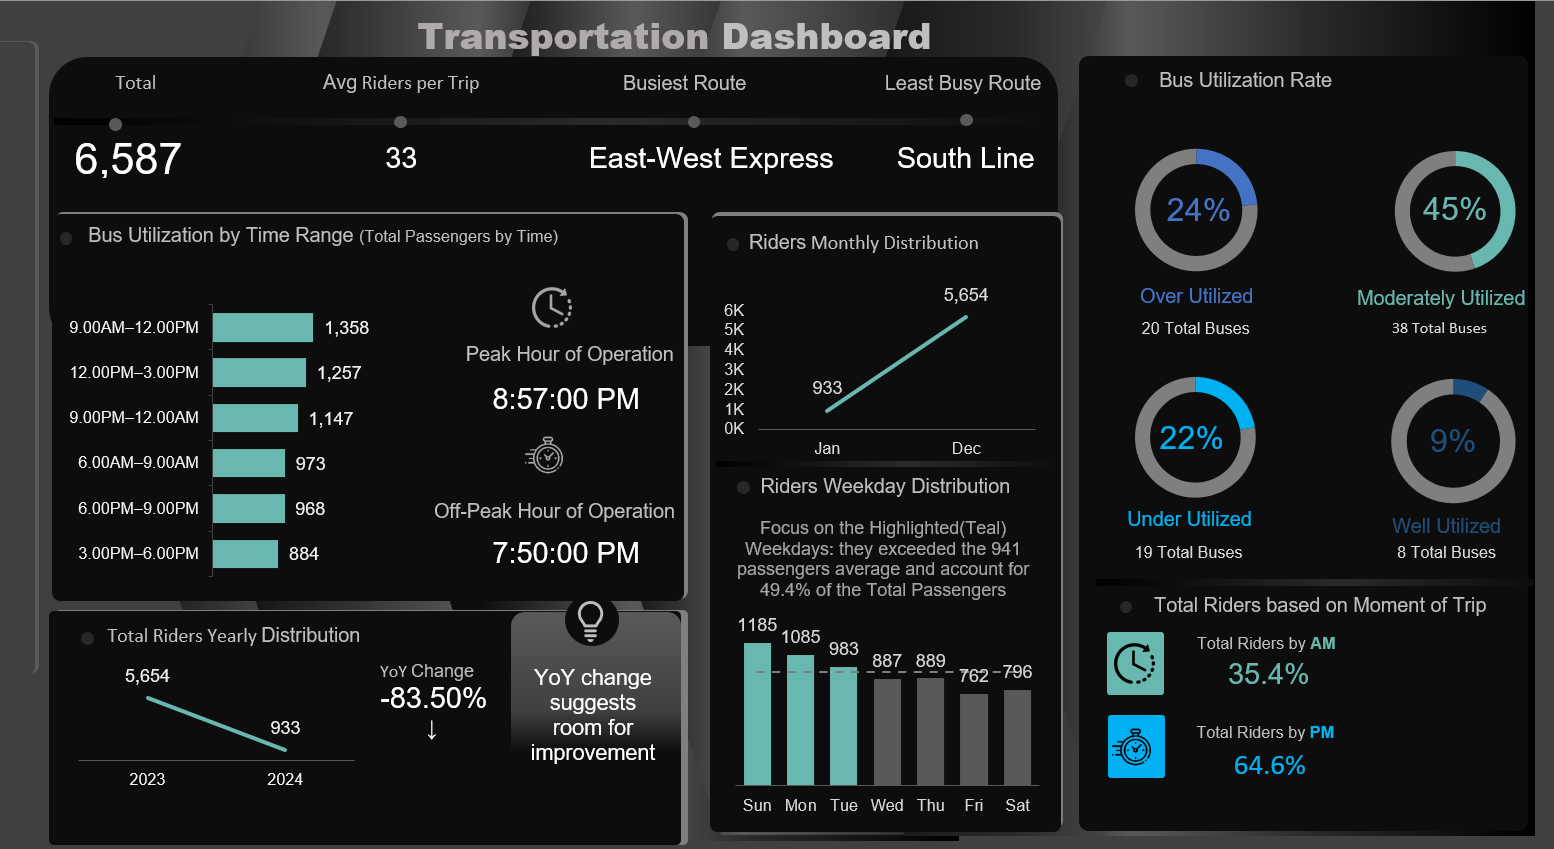
Designed and developed an automated, interactive Excel dashboard to analyze bus transportation trends, usage, and performance for operational decision-making. Built using Excel with Power Query and Power Pivot, the dashboard automatically updates when new data is added, transforming raw transportation data into dynamic, decision-ready insights.
Key Insights:
- Busiest and least busy routes: East-West Express most congested, South Line least congested.
- Peak operating hours: 8:57 PM; Off-peak: 7:50 PM.
- Bus utilization breakdown: 24% over-utilized, 22% under-utilized, 45% moderately utilized, 9% well-utilized.
- Year-over-year ridership decline: -83.5%.
Data Model: Structured star schema in Excel Power Pivot with fact and dimension tables for efficient reporting and automated refresh.
Technologies: Microsoft Excel, Power Query, Power Pivot, DAX, PivotTables, Data Visualization & Dashboard Design.
View ProjectSQL Exploratory Data Analysis — Restaurant Performance Optimization
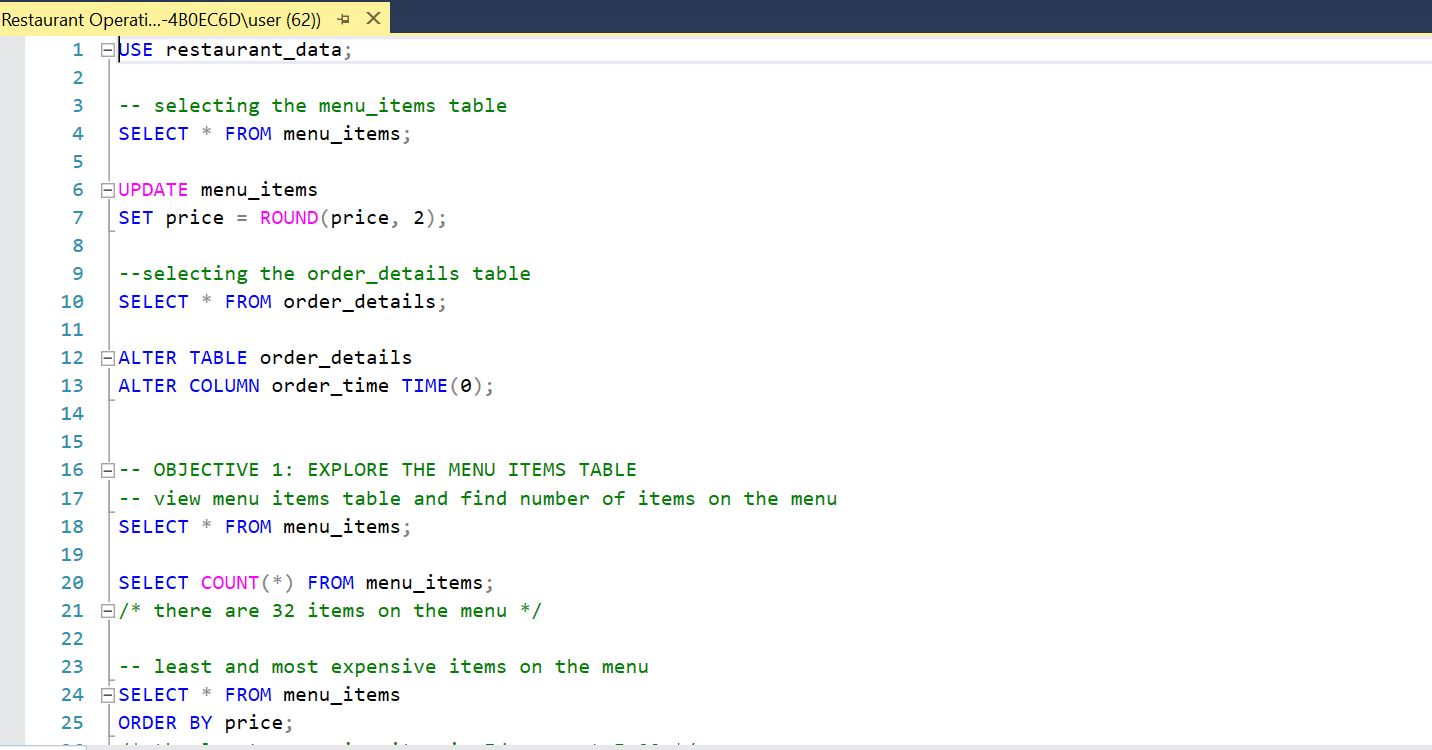
Performed comprehensive SQL-based exploratory data analysis to evaluate restaurant sales, customer preferences, and pricing strategies using menu_items and order_details tables, providing actionable operational insights.
Key Insights:
- Italian dishes are the most expensive (avg. $16.75), while American dishes are the cheapest (avg. $10.07).
- The Hamburger is the most ordered item (622 orders); Chicken Tacos the least (123 orders).
- High-spending orders favor Italian cuisine, with the top order totaling $192.15 for 14 items.
- 20 orders included more than 12 items, indicating group/family dining patterns.
Limitations & Future Work:
- Analysis is descriptive only — does not predict menu performance trends.
- Customer demographics were not included; future work could integrate loyalty and behavioral data.
- Planned enhancements: predictive sales modeling, pricing optimization, and targeted promotions for high-spending customers.
Technologies: SQL (PostgreSQL/MySQL), Data Cleaning, Data Analysis, Joins, Aggregations.
Covid‑19 Visualization – Tableau Dashboard
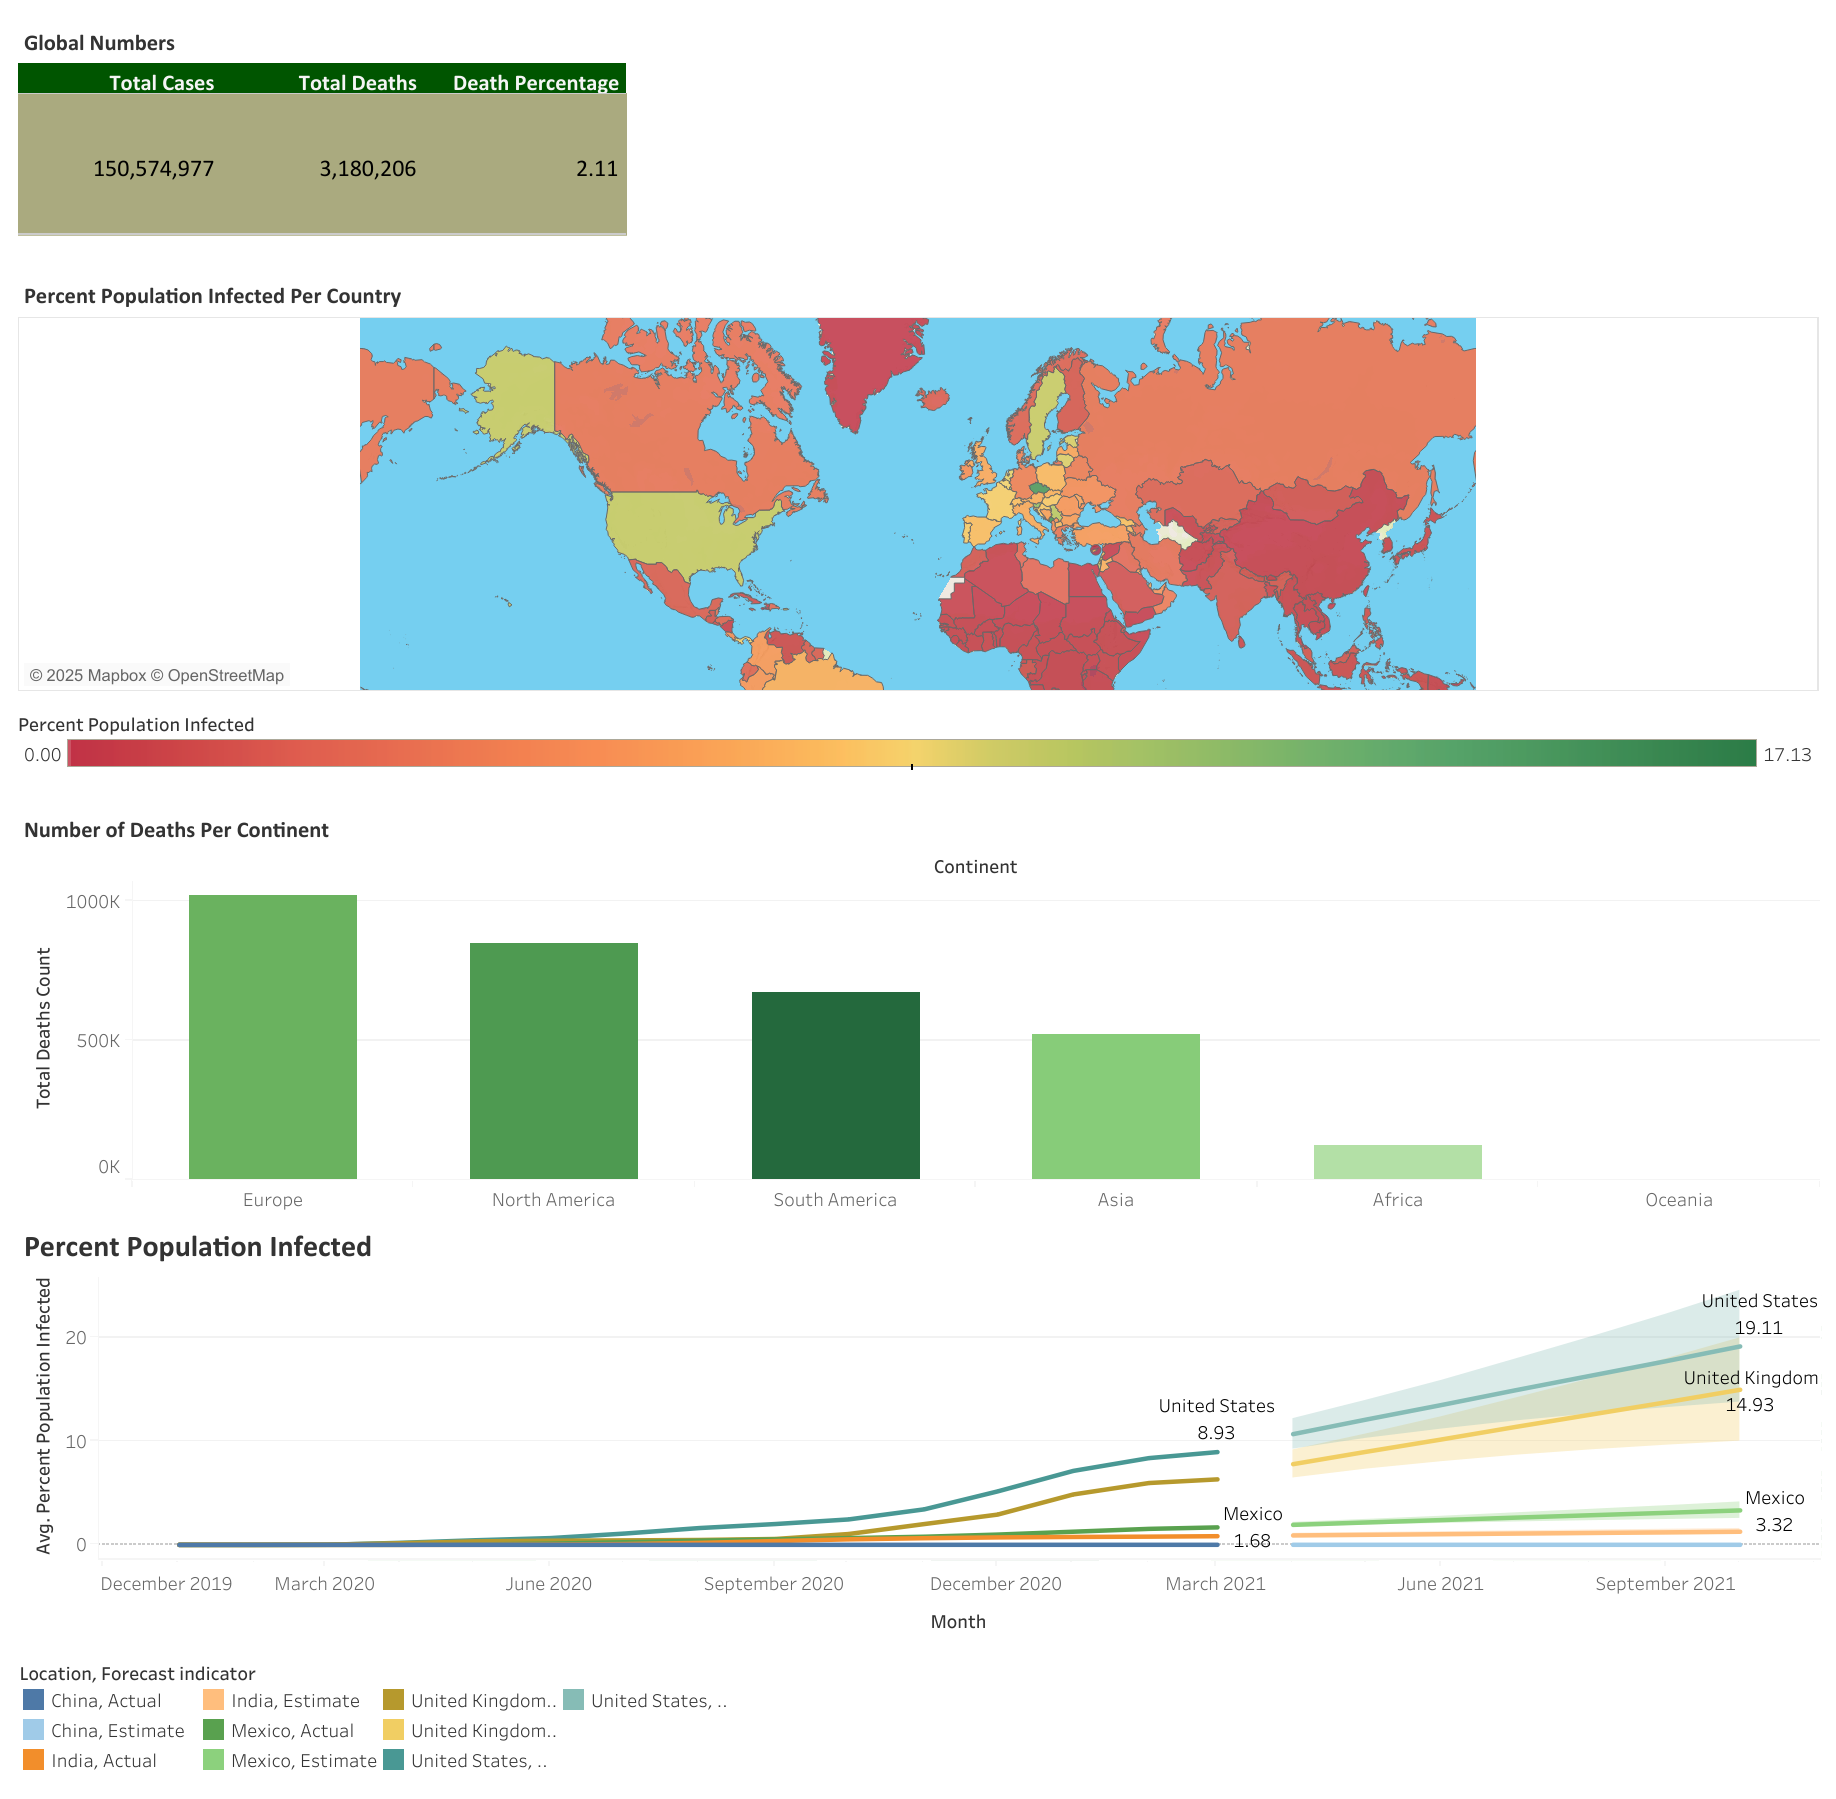
Interactive Tableau dashboard visualizing global Covid‑19 trends, with global and country-specific insights.
Key Insights:
- Covid‑19 cases show distinct waves, major surges in specific months.
- Certain countries/regions consistently reported higher case counts.
- Death rates varied significantly across regions.
- Recovery rates improved over time with vaccination coverage expansion.
- Some regions reported lower case counts due to limited testing/under-reporting.
Technologies: Tableau, CSV Data Processing, Data Visualization, Interactive Dashboard Design.
View ProjectHR Data Analytics Dashboard — Power BI

Developed an interactive HR Analytics Dashboard in Power BI to track and analyze attrition patterns across demographics, roles, and compensation.
Key Insights:
- High-risk roles: Research Scientists (100), Human Resources (58), Sales Representatives (44).
- Most vulnerable age group: 26–35 years (116 attrition cases).
- Most attrition from employees earning under 5k, and those with less than 1 year tenure.
Limitations & Future Work:
- Currently descriptive only — does not predict attrition risk.
- No qualitative data (exit interviews/surveys) included.
- Planned enhancements: predictive modeling, exit interview analysis, attrition cost calculation.
Technologies: Power BI, Power Query, DAX, Data Cleaning, KPI Design, Dashboard Development, HR Analytics.
Movie Genres Data Analysis Project — Python & Jupyter
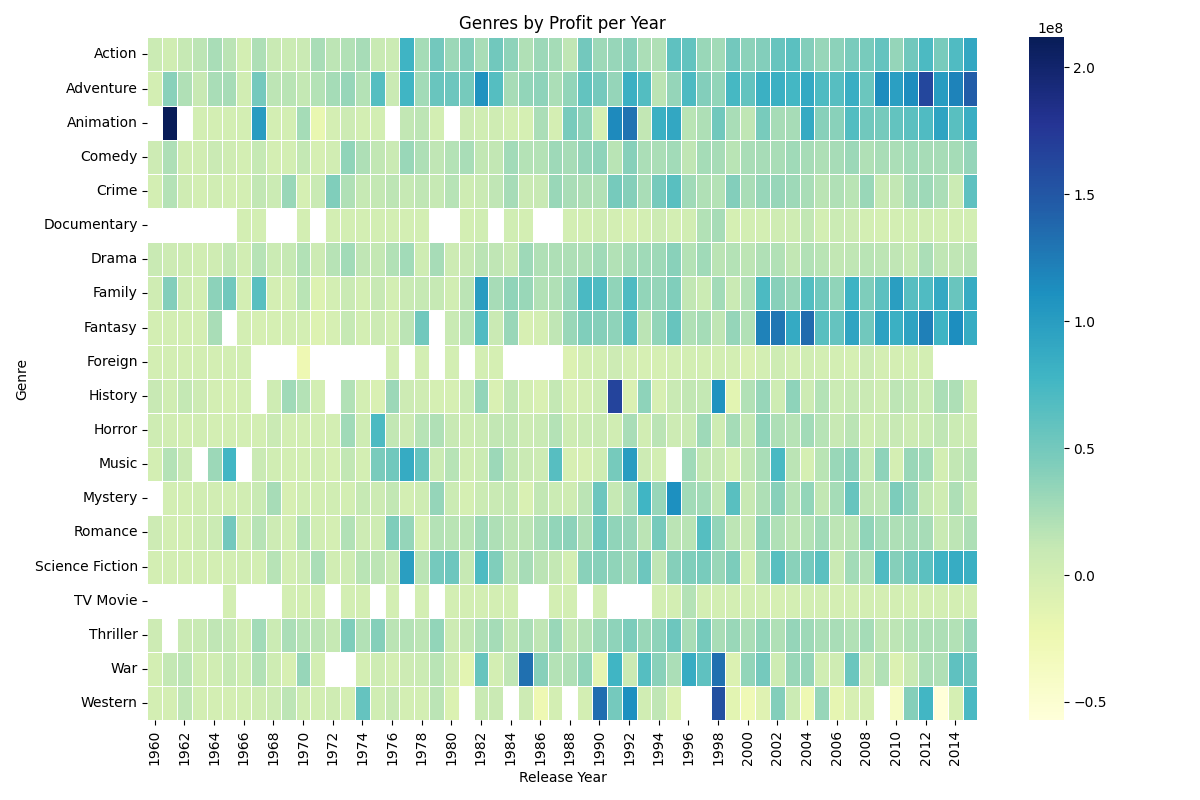
Performed a detailed analysis of movie datasets to explore trends in genres, budgets, revenues, popularity, and vote patterns using Python and Jupyter Notebook.
Key Insights:
- Top 3 most common genres: Drama, Comedy, Thriller.
- Genres with highest average budget and revenue: Adventure, Fantasy, Action.
- Highest popularity: Adventure, Science Fiction, Fantasy; Lowest: Documentary, Foreign, TV Movie.
- Highly rated movies (vote_average ≥ 8): Documentary, Drama, Crime.
Key Challenges & Considerations:
- Handling missing or inconsistent data.
- Splitting multiple genres per movie accurately.
- Analysis is descriptive; correlation does not imply causation.
Technologies: Python (Pandas, Matplotlib, Seaborn), Jupyter Notebook, Data Cleaning, Data Analysis, Data Visualization.